HR Analytics & EDA: Employee Workforce Report
1,020 employee records, cleaned and analyzed to see whether pay actually lines up with performance.
Table of Contents
- Project Overview
- Dataset Summary
- Data Quality Issues & Cleaning
- Exploratory Data Analysis
- Salary Distribution Overview
- Above vs Below Average Salary
- Top 7 Highest Paid Employees
- Top 7 Lowest Paid Employees
- Salary vs Performance Deep Dive
- High Earners with Excellent Performance
- High Earners with Poor Performance
- Low Earners with Excellent Performance
- Low Earners with Poor Performance
- Key Business Takeaways
- Tools & Technologies
Hint: Tap on any chart in this report to expand it full screen.
Project Overview
This project started with a real-world messy employee dataset pulled straight out of an HR system: inconsistent types, missing values, useless columns, the works.
The goal was simple: clean it, understand it, and pull out insights that actually matter.
No fancy ML models, no over-engineering. Just solid data cleaning, thoughtful exploratory analysis, and clear visualizations that speak for themselves.
What was done:
- Identified and handled missing values using statistically sound imputation (grouped medians, not blind averages)
- Fixed data types: dates stored as strings, salary as floats, age with decimal noise
- Dropped irrelevant columns that added zero analytical value
- Ran targeted EDA focusing on salary distribution, performance-salary relationships, and department-level patterns
- Built visualizations that surface the story behind the numbers
Dataset Summary
| Attribute | Detail |
|---|---|
| Total Records | 1,020 employees |
| Columns (Raw) | 12 |
| Columns (Final) | 10 (after dropping Email & Phone) |
| Employee ID Range | EMP1000 – EMP2019 |
| Unique Departments | 36 department-region combinations |
| Employee Statuses | Active, Inactive, Pending |
| Performance Tiers | Excellent, Good, Average, Poor |
| Salary Range | $50,047 – $119,971 |
| Age Range | 25 – 40 years |
| Hire Date Coverage | 2020 – 2024 |
Final clean columns: Employee_ID, First_Name, Last_Name, Age, Department_Region, Status, Join_Date, Salary, Performance_Score, Remote_Work
Data Quality Issues & Cleaning
The raw dataset had several problems that needed attention before any analysis could happen.
Issues Found
| Column | Issue | Records Affected |
|---|---|---|
| Age | Missing values (NaN) | 211 out of 1,020 (~20.7%) |
| Salary | Missing values (NaN) | 24 out of 1,020 (~2.4%) |
| Join_Date | Stored as string, not datetime | All 1,020 records |
| Age | Float type instead of integer | All non-null records |
| Salary | Float with unnecessary decimals | All non-null records |
| Not useful for analysis | Dropped entirely | |
| Phone | Negative/corrupted values, not useful | Dropped entirely |
How It Was Handled
Age: Missing values were filled using the median age grouped by department-region. Not a flat median across the board, but grouped so that if DevOps-California skews younger and Finance-Texas skews older, the imputation respects that. Histogram and box plot were checked first to confirm the distribution before choosing median over mean.
Salary: Same approach. Grouped by department-region, then filled with the group median. This matters because a missing salary in HR-Florida shouldn't be filled with the overall company average when that department might pay differently.
Join_Date: Converted from raw string format ("4/2/2021") to proper pandas datetime for any time-based analysis.
Email & Phone: Both dropped. Email had no analytical value. Phone numbers were corrupted (negative values like -1651623197), clearly bad data, so they were removed rather than guessed at.
After cleaning: zero null values across all 10 columns. Clean dataset, no compromises.
Exploratory Data Analysis
Salary Distribution Overview
| Metric | Value |
|---|---|
| Mean Salary | $85,172 |
| Median Salary | $85,547 |
| Min Salary | $50,047 |
| Max Salary | $119,971 |
| Standard Deviation | $19,873 |
The mean and median are nearly identical ($85,172 vs $85,547), which tells us the salary distribution is close to symmetric: no heavy skew toward high or low earners. This is a fairly balanced payroll.
Above vs Below Average Salary
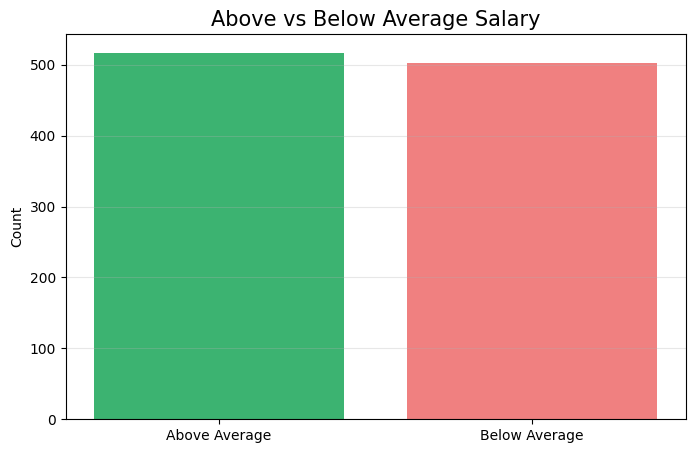
The workforce was split based on the average salary threshold of $85,172.
| Category | Employee Count | Share |
|---|---|---|
| Above Average | 517 | 50.7% |
| Below Average | 503 | 49.3% |
Almost a perfect 50/50 split. This further confirms the balanced distribution: the company isn't top-heavy or bottom-heavy in compensation.
Top departments with above-average earners:
| Department-Region | Count |
|---|---|
| DevOps-Florida | 21 |
| Admin-California | 21 |
| Admin-Illinois | 21 |
| Sales-Florida | 21 |
| Finance-California | 20 |
| Cloud Tech-Florida | 20 |
Top departments with below-average earners:
| Department-Region | Count |
|---|---|
| Finance-Illinois | 24 |
| HR-Florida | 22 |
| Admin-Nevada | 20 |
| Sales-Nevada | 20 |
| DevOps-California | 19 |
A few patterns here. Florida-based departments show up on both sides, which suggests salary variance within the state rather than a uniform pay structure. Finance-Illinois stands out as having the highest concentration of below-average earners.
Age breakdown of above-average earners:
| Age | Count |
|---|---|
| 30 | 156 |
| 35 | 129 |
| 40 | 120 |
| 25 | 99 |
| 32 | 13 |
Employees aged 30 dominate the above-average salary bracket. The 25-year-old group has the smallest representation up top, which makes sense, as they're likely early in their careers.
Top 7 Highest Paid Employees
| Rank | Name | Salary | Age | Department | Status | Performance |
|---|---|---|---|---|---|---|
| 1 | Charlie Smith | $119,971 | 30 | Cloud Tech-Texas | Inactive | Average |
| 2 | Grace Smith | $119,890 | 30 | HR-Nevada | Active | Average |
| 3 | Bob Williams | $119,801 | 30 | Sales-California | Active | Average |
| 4 | Frank Johnson | $119,764 | 40 | Sales-Illinois | Inactive | Average |
| 5 | Grace Brown | $119,586 | 30 | DevOps-Illinois | Active | Average |
| 6 | Alice Brown | $119,574 | 30 | Admin-Illinois | Inactive | Average |
| 7 | Alice Miller | $119,407 | 30 | Sales-Florida | Inactive | Excellent |
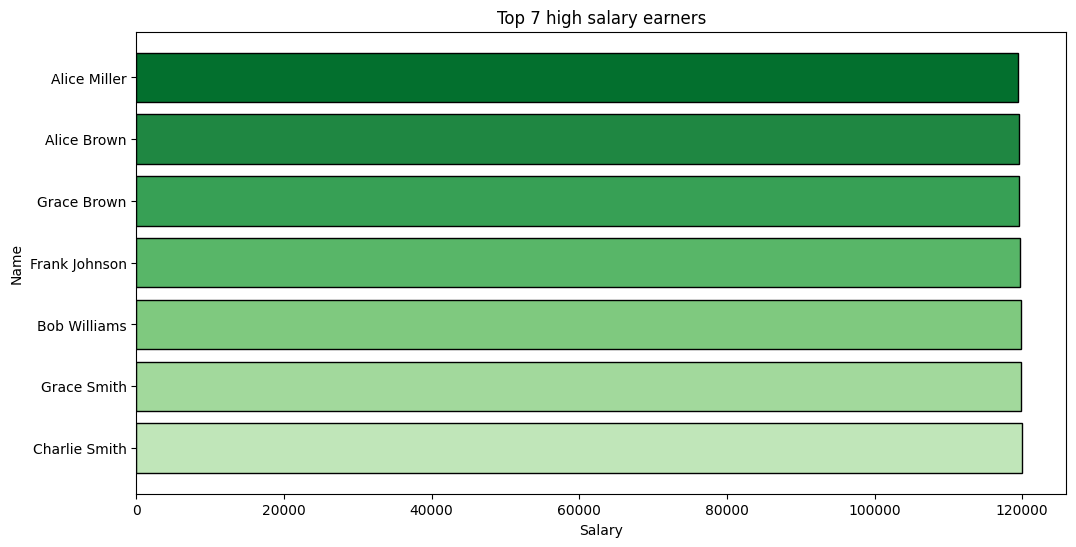
Something worth noting that 6 out of the top 7 earners have an "Average" performance score, not "Excellent." And 5 of them are 30 years old. The highest paid employee in the company (Charlie Smith, $119,971) is rated Average and currently Inactive. That raises questions about whether compensation is truly tied to performance, or if there are other factors driving pay at the top.
Top 7 Lowest Paid Employees
| Rank | Name | Salary | Age | Department | Status | Performance |
|---|---|---|---|---|---|---|
| 1 | Heidi Williams | $50,047 | 25 | Cloud Tech-New York | Inactive | Good |
| 2 | Heidi Johnson | $50,060 | 25 | Finance-New York | Pending | Poor |
| 3 | Charlie Garcia | $50,110 | 35 | Admin-Nevada | Inactive | Average |
| 4 | Frank Davis | $50,153 | 40 | Cloud Tech-Texas | Pending | Good |
| 5 | Eva Williams | $50,173 | 35 | Finance-Florida | Inactive | Poor |
| 6 | Alice Garcia | $50,288 | 35 | Sales-New York | Active | Excellent |
| 7 | Grace Smith | $50,300 | 40 | Admin-Florida | Inactive | Good |
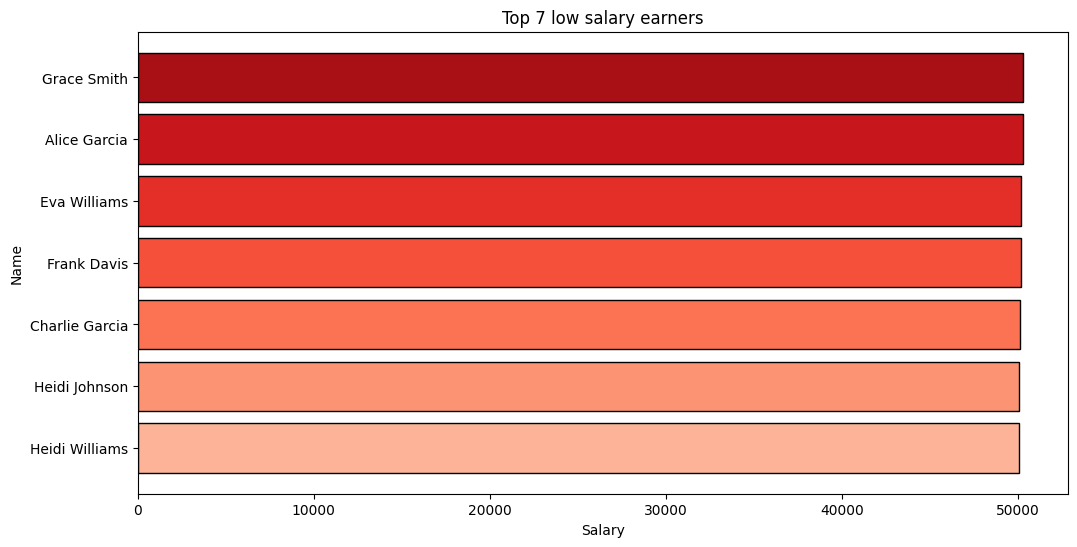
Interestingly, the lowest earners aren't all young employees. Ages range from 25 to 40. Alice Garcia (#6) has an Excellent performance score but earns just $50,288. She's one of the lowest paid people in the entire company despite being a top performer. That's a retention risk flag right there.
Salary vs Performance Deep Dive
This is where it gets interesting. The dataset has 216 employees rated "Poor" out of 1,020 total. That's roughly 21% of the workforce.
The analysis below breaks down salary extremes within performance tiers to answer a simple question: does pay match performance here?
High Earners with Excellent Performance
These are the employees doing it right: top performance, top pay.
| Rank | Name | Salary | Age | Department | Status | Remote |
|---|---|---|---|---|---|---|
| 1 | Alice Miller | $119,407 | 30 | Sales-Florida | Inactive | Yes |
| 2 | Alice Williams | $118,907 | 35 | Admin-California | Active | Yes |
| 3 | Bob Miller | $118,869 | 35 | DevOps-Illinois | Active | Yes |
| 4 | Charlie Brown | $118,677 | 30 | HR-New York | Active | No |
| 5 | Frank Smith | $118,456 | 30 | HR-Nevada | Inactive | Yes |
| 6 | Eva Jones | $118,030 | 32 | Admin-Florida | Inactive | Yes |
| 7 | David Jones | $117,870 | 35 | DevOps-Texas | Inactive | No |
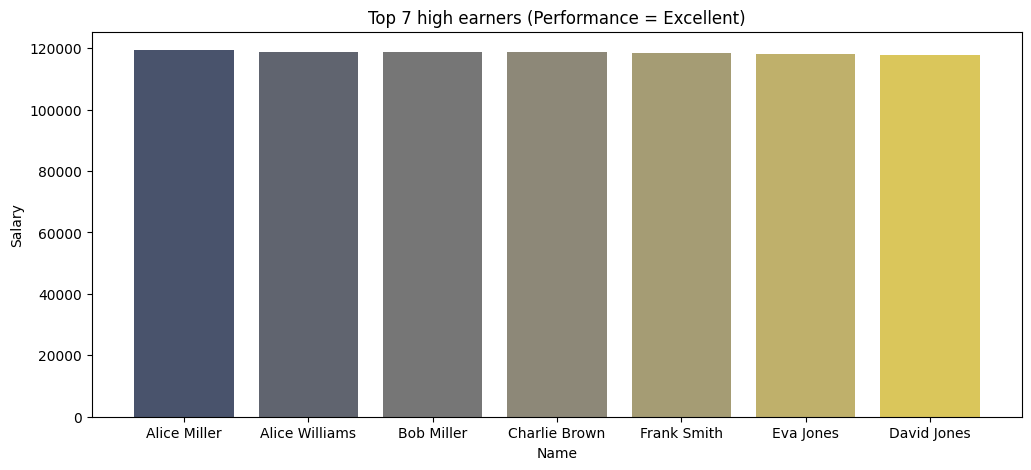
Salaries range from $117,870 to $119,407. These are people earning near the company maximum and delivering excellent results. Worth noting that 5 out of 7 are remote workers, and ages are clustered between 30–35. However, 4 out of 7 are Inactive, which is a concern. If your best-performing, highest-paid employees are leaving, that's a serious business problem.
High Earners with Poor Performance
This is the red flag group. High salary, low output.
| Rank | Name | Salary | Age | Department | Status | Remote |
|---|---|---|---|---|---|---|
| 1 | Charlie Miller | $119,389 | 35 | Cloud Tech-Florida | Active | No |
| 2 | Alice Smith | $119,311 | 35 | Admin-California | Pending | Yes |
| 3 | David Johnson | $119,217 | 30 | Cloud Tech-Texas | Inactive | No |
| 4 | Bob Brown | $119,152 | 40 | Admin-Florida | Pending | Yes |
| 5 | Frank Jones | $118,907 | 40 | Sales-California | Inactive | No |
| 6 | Alice Williams | $118,672 | 40 | Finance-Texas | Pending | No |
| 7 | Bob Garcia | $118,413 | 40 | Finance-Nevada | Inactive | No |
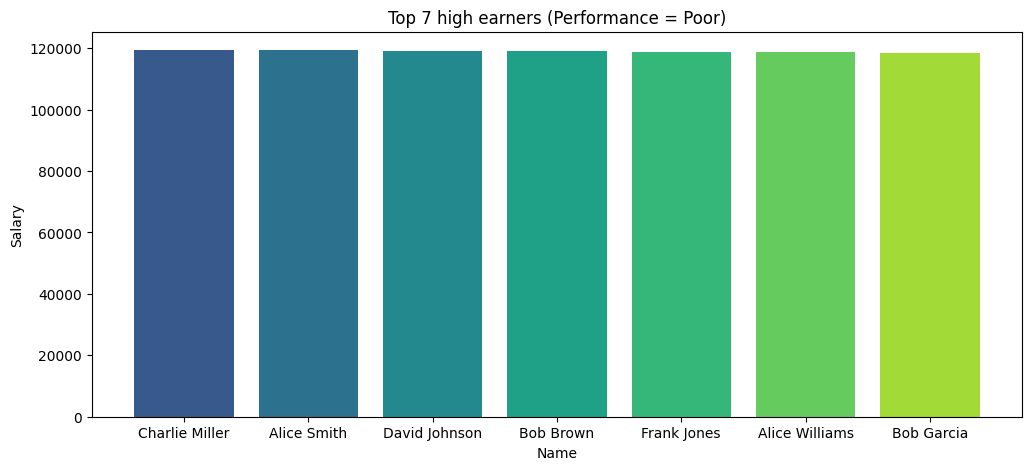
These 7 employees earn between $118,413 and $119,389: nearly the same range as the excellent performers. Charlie Miller earns $119,389 with a Poor rating; Alice Miller (Excellent) earns $119,407. That's an $18 difference for vastly different performance levels.
Also notable: 5 out of 7 are not working remotely, and 4 out of 7 are aged 40 (the oldest bracket in the dataset). This suggests the compensation structure may be rewarding tenure or seniority rather than actual output.
Low Earners with Excellent Performance
These are the undervalued employees: delivering excellent work but sitting at the very bottom of the pay scale.
| Rank | Name | Salary | Age | Department | Status | Remote |
|---|---|---|---|---|---|---|
| 1 | Alice Garcia | $50,288 | 35 | Sales-New York | Active | No |
| 2 | Frank Davis | $50,593 | 30 | HR-Illinois | Active | Yes |
| 3 | David Miller | $51,054 | 25 | Admin-Nevada | Inactive | No |
| 4 | Frank Brown | $51,074 | 25 | Finance-Texas | Pending | Yes |
| 5 | Heidi Garcia | $51,150 | 25 | Cloud Tech-Florida | Pending | No |
| 6 | Frank Smith | $51,311 | 25 | Finance-Nevada | Active | No |
| 7 | David Smith | $51,939 | 40 | Admin-Texas | Active | Yes |
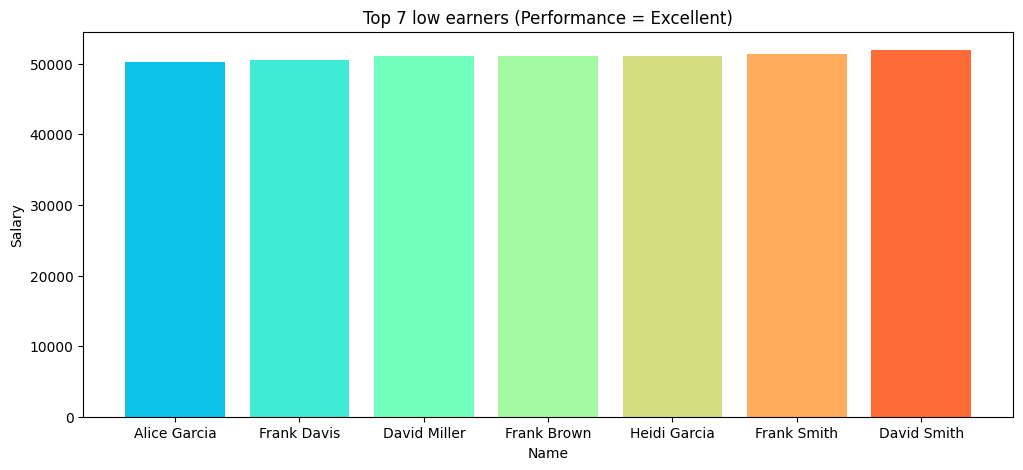
These employees earn between $50,288 and $51,939 while consistently rated Excellent. Alice Garcia brings in $50,288. Compare that to Charlie Miller (Poor) earning $119,389. That's a $69,101 gap between a top performer and a bottom performer.
4 out of 7 here are 25 years old, which might explain the lower salary as entry-level positioning, but performance ratings don't care about age. If someone's delivering Excellent results, they should be compensated accordingly. This group represents the highest retention risk in the organization.
Low Earners with Poor Performance
| Rank | Name | Salary | Age | Department | Status | Remote |
|---|---|---|---|---|---|---|
| 1 | Heidi Johnson | $50,060 | 25 | Finance-New York | Pending | No |
| 2 | Eva Williams | $50,173 | 35 | Finance-Florida | Inactive | No |
| 3 | Heidi Johnson | $50,651 | 30 | Admin-Nevada | Pending | No |
| 4 | Charlie Jones | $51,533 | 35 | DevOps-New York | Inactive | Yes |
| 5 | David Smith | $51,673 | 32 | Admin-New York | Active | No |
| 6 | Grace Davis | $51,865 | 30 | HR-Nevada | Pending | Yes |
| 7 | Alice Miller | $52,289 | 25 | Finance-Nevada | Inactive | Yes |
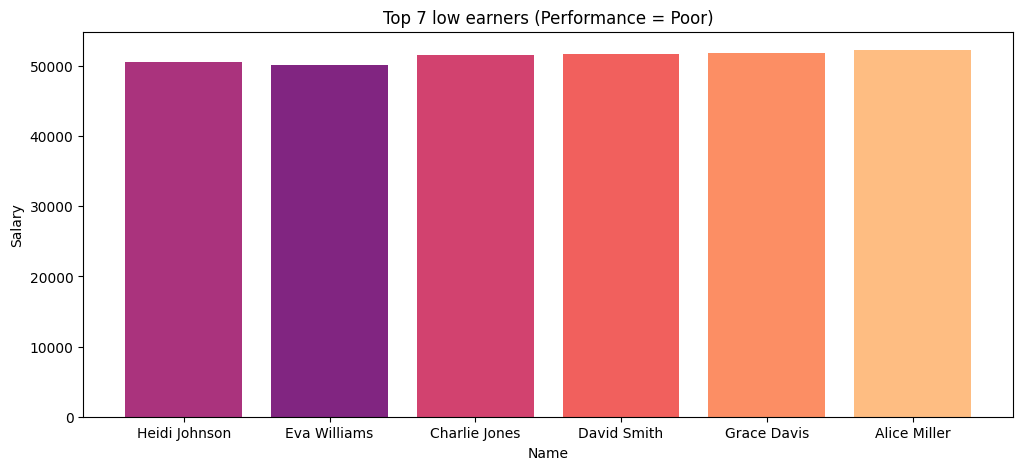
Low pay, low performance. This group is where it lines up: salary reflects output. The concerning pattern is that 5 out of 7 are not remote workers, and the statuses lean heavily toward Inactive/Pending rather than Active. These may be employees who were already on their way out.
Key Business Takeaways
1. Compensation Is Not Aligned with Performance
The most critical finding. Employees rated "Poor" earn almost identical salaries to those rated "Excellent" at the top end (~$119K for both). The pay-for-performance model appears broken, or it doesn't exist at all.
2. High-Performing, Low-Paid Employees Are a Retention Risk
7 employees rated Excellent earn between $50K–$52K. These are people delivering top results at bottom-tier pay. If compensation isn't corrected, the company risks losing its best talent, especially Alice Garcia ($50,288, Excellent, Active).
3. 21% of the Workforce Is Rated "Poor"
216 out of 1,020 employees carry a Poor performance score. That's over one-fifth of the workforce. Combined with the fact that some of these employees are among the highest paid, this suggests a need for performance-based compensation reviews.
4. Age 30 Dominates the High-Earning Bracket
The 30-year-old cohort leads across above-average earners (156 employees). This could indicate a sweet spot where employees have enough experience to command higher salaries but haven't yet hit career plateaus.
5. Remote Work Correlates with Higher Performance
Among high earners with Excellent performance, 5 out of 7 work remotely. Among high earners with Poor performance, only 2 out of 7 are remote. While this isn't causal, it's a pattern worth investigating further.
6. Florida and California Show Up Everywhere
These two states appear across both the highest and lowest salary brackets, the best and worst performers. They likely represent the company's largest regional hubs and may need localized compensation strategies.
7. Inactive Status Among Top Performers Is Alarming
4 out of 7 highest-paid Excellent performers are Inactive. If the company's best people are leaving despite good pay, the problem goes beyond compensation; it could be culture, growth opportunities, or management.
Tools & Technologies
| Tool | Purpose |
|---|---|
| Python | Core language for data processing and analysis |
| Pandas | Data cleaning, manipulation, groupby operations, imputation |
| Matplotlib | All visualizations: bar charts, horizontal bars, histograms, box plots |
| Jupyter Notebook | Interactive development environment for the full analysis pipeline |
Analysis conducted on a real-world messy dataset. All values reflect the cleaned and processed data.