Brazilian E-Commerce Analytics Report
An in-depth SQL-driven analysis of 99,441 orders to uncover revenue drivers, customer behavior, and operational performance using the Olist dataset.
Table of Contents
- Project Overview
- Dataset Summary & Key Counts
- Data Preparation & Database Integration
- SQL Analysis & Key Findings
- Yearly & Monthly Revenue Trends
- Customer & Geographic Insights
- Product & Category Performance
- Order Status & Logistics
- Payment Trends
- Seller Performance
- Business Intelligence Dashboard
- Actionable Business Takeaways
- Tools & Technologies
Hint: Tap on any chart in this report to expand it full screen.
Project Overview
This project deeply analyzes 99,441 e-commerce orders from Olist (a Brazilian marketplace) to evaluate revenue trends, geographic distribution, product performance, logistics reliability, and customer payment behaviors.
The core analysis was performed entirely within a Jupyter Notebook environment (notebooks/03_sql_analysis.ipynb). Rather than relying solely on native Pandas functions, we established a connection to a local MySQL database using mysql-connector-python and pandas. This allowed us to execute complex SQL queries directly against the database and fetch the results into DataFrames for seamless reporting.
Dataset Summary & Key Counts
The foundational counts derived from the initial data discovery are:
| Metric | Count |
|---|---|
| Total Orders | 99,441 |
| Total Customers (Records) | 99,441 |
| Unique Customers | 96,096 |
| Total Sellers | 3,095 |
| Total Products | 32,951 |
| Product Categories | 73 |
Data Preparation & Database Integration
The Data Pipeline
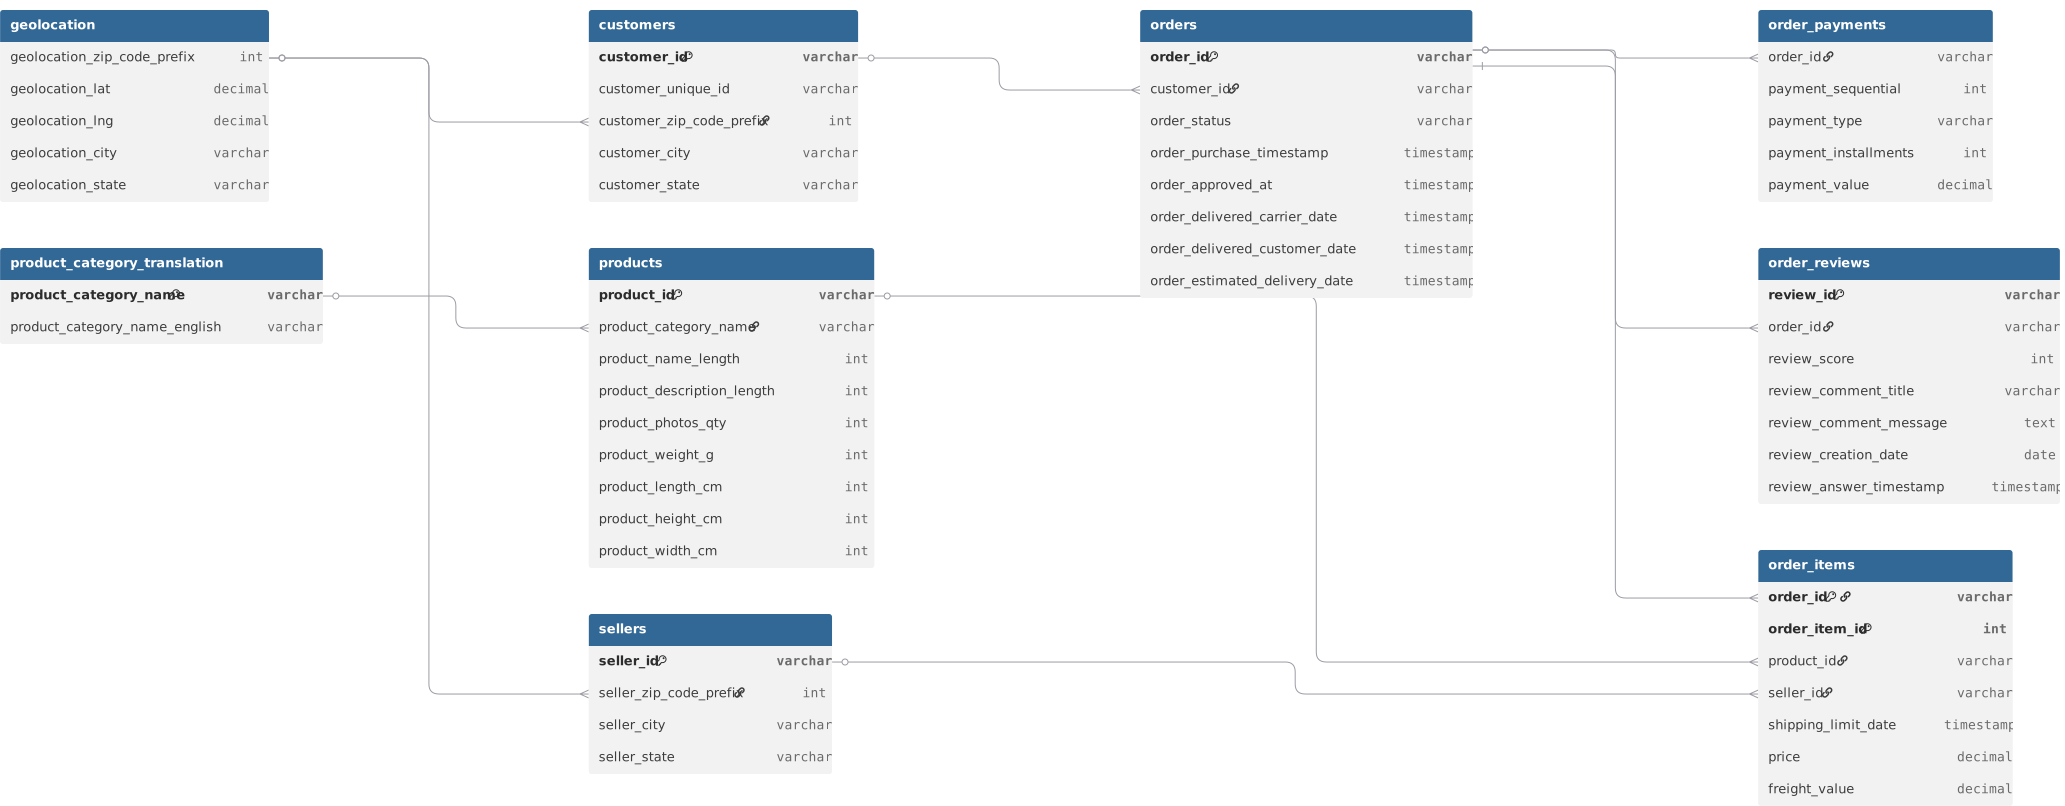
The analysis is built on top of a local MySQL database. Raw CSV files were initially cleaned using a Python/Pandas pipeline and ingested into a structured relational schema. Missing values (e.g., in order_delivered_customer_date or order_reviews) were intentionally preserved to accurately represent the business reality of items still in-transit or without a customer review.
Entity Relationship Diagram (ERD)
SQL Analysis & Key Findings
This section contains every metric directly queried and extracted from the database.
Yearly & Monthly Revenue Trends
Total Orders and Revenue Per Year:
| Year | Total Orders | Total Revenue (R$) |
|---|---|---|
| 2016 | 370 | 49,785.92 |
| 2017 | 50,864 | 6,155,806.98 |
| 2018 | 61,416 | 7,386,050.80 |
Monthly Orders & AOV (Average Order Value) Highlights: Order volume grew from just a few hundred in late 2016 to thousands per month in 2017 and 2018. - Peak Month (Black Friday): November 2017 saw 8,665 orders generating over R$ 1,010,271 in revenue. - Consistent Volume: 2018 stabilized at around 6,000 to 8,200 orders per month.
Customer & Geographic Insights
Average Review Score: 4.08 / 5.0
Top 10 States by Customers:
| Rank | State | Customer Count |
|---|---|---|
| 1 | SP (São Paulo) | 40,302 |
| 2 | RJ (Rio de Janeiro) | 12,384 |
| 3 | MG (Minas Gerais) | 11,259 |
| 4 | RS (Rio Grande do Sul) | 5,277 |
| 5 | PR (Paraná) | 4,882 |
| 6 | SC (Santa Catarina) | 3,534 |
| 7 | BA (Bahia) | 3,277 |
| 8 | DF (Distrito Federal) | 2,075 |
| 9 | ES (Espírito Santo) | 1,964 |
| 10 | GO (Goiás) | 1,952 |
Revenue by State (Top 5):
| Rank | State | Total Revenue (R$) |
|---|---|---|
| 1 | SP | 5,202,955.05 |
| 2 | RJ | 1,824,092.67 |
| 3 | MG | 1,585,308.03 |
| 4 | RS | 750,304.02 |
| 5 | PR | 683,083.76 |
Top 10 Customers with Most Orders: Most customers purchase once, but a few loyal customers returned heavily:
| Rank | Customer ID | Orders Placed |
|---|---|---|
| 1 | 8d50f5eadf50201ccdcedfb9e2ac8455 |
17 |
| 2 | 3e43e6105506432c953e165fb2acf44c |
9 |
| 3 | 1b6c7548a2a1f9037c1fd3ddfed95f33 |
7 |
| 4 | 6469f99c1f9dfae7733b25662e7f1782 |
7 |
| 5 | ca77025e7201e3b30c44b472ff346268 |
7 |
| 6 | f0e310a6839dce9de1638e0fe5ab282a |
6 |
| 7 | dc813062e0fc23409cd255f7f53c7074 |
6 |
| 8 | de34b16117594161a6a89c50b289d35a |
6 |
| 9 | 12f5d6e1cbf93dafd9dcc19095df0b3d |
6 |
| 10 | 47c1a3033b8b77b3ab6e109eb4d5fdf3 |
6 |
Product & Category Performance
Top 10 Product Categories by Value Counts (Inventory Breadth):
| Rank | Category Name | Count |
|---|---|---|
| 1 | cama_mesa_banho (Bed, Bath & Table) | 3,029 |
| 2 | esporte_lazer (Sports & Leisure) | 2,867 |
| 3 | moveis_decoracao (Furniture & Decor) | 2,657 |
| 4 | beleza_saude (Health & Beauty) | 2,444 |
| 5 | utilidades_domesticas (Housewares) | 2,335 |
| 6 | automotivo (Auto) | 1,900 |
| 7 | informatica_acessorios (Computers & Accessories) | 1,639 |
| 8 | brinquedos (Toys) | 1,411 |
| 9 | relogios_presentes (Watches & Gifts) | 1,329 |
| 10 | telefonia (Telephony) | 1,134 |
Revenue by Product Category (Top 5):
| Rank | Category Name | Total Revenue (R$) |
|---|---|---|
| 1 | Health & Beauty | 1,258,681.34 |
| 2 | Watches & Gifts | 1,205,005.68 |
| 3 | Bed, Bath & Table | 1,036,988.68 |
| 4 | Sports & Leisure | 988,048.97 |
| 5 | Computers & Accessories | 911,954.32 |
Order Status & Logistics
Order Status Distribution: Out of 99,441 total orders:
| Order Status | Count | Percentage |
|---|---|---|
| Delivered | 96,478 | ~97.02% |
| Shipped (in transit) | 1,107 | ~1.11% |
| Canceled | 625 | ~0.63% |
| Unavailable | 609 | ~0.61% |
| Invoiced | 314 | ~0.32% |
| Processing | 301 | ~0.30% |
| Created | 5 | ~0.01% |
| Approved | 2 | <0.01% |
Average Delivery Time by State: Delivery times are directly correlated to geographic proximity to the Southeast hubs:
| Category | State | Avg Delivery (Days) |
|---|---|---|
| Fastest | SP | 8.70 |
| Fastest | PR | 11.93 |
| Fastest | MG | 11.94 |
| Slowest | AM | 26.35 |
| Slowest | AP | 27.17 |
| Slowest | RR | 29.34 |
Top Products by Highest Freight Cost:
| Rank | Product ID | Total Freight Cost (R$) |
|---|---|---|
| 1 | d1c427060a0f73f6b889a5c7c61f2ac4 |
13,761.52 |
| 2 | 99a4788cb24856965c36a24e339b6058 |
8,046.04 |
| 3 | 422879e10f46682990de24d770e7f83d |
7,624.04 |
Payment Trends
Payment Methods Used (Highest to Lowest):
| Payment Method | Transaction Count |
|---|---|
| Credit Card | 76,795 |
| Boleto (Bancário) | 19,784 |
| Voucher | 5,775 |
| Debit Card | 1,529 |
| Not Defined | 3 |
Payment Installment Insights: - Average Payment Installments: 2.85 installments across all orders.
Top Products Requiring the Most Installments:
| Rank | Product ID | Avg Installments |
|---|---|---|
| 1 | ff92ca9bb0b3f4ec00a9b76c9f68cb3a |
10.29 |
| 2 | 0433830caca22b01a0f477d31307b043 |
9.57 |
| 3 | 6a162a899a815ed15db1689e8efc976c |
9.10 |
Seller Performance
Top 5 Sellers by Total Orders:
| Rank | Seller ID | Orders Processed |
|---|---|---|
| 1 | 6560211a19b47992c3666cc44a7e94c0 |
2,033 |
| 2 | 4a3ca9315b744ce9f8e9374361493884 |
1,987 |
| 3 | 1f50f920176fa81dab994f9023523100 |
1,931 |
| 4 | cc419e0650a3c5ba77189a1882b7556a |
1,775 |
| 5 | da8622b14eb17ae2831f4ac5b9dab84a |
1,551 |
Business Intelligence Dashboard
The Power BI dashboard visualizes the core business KPIs. Note: Due to dataset schema limitations, the dashboard displays raw seller_id hashes instead of human-readable seller names.
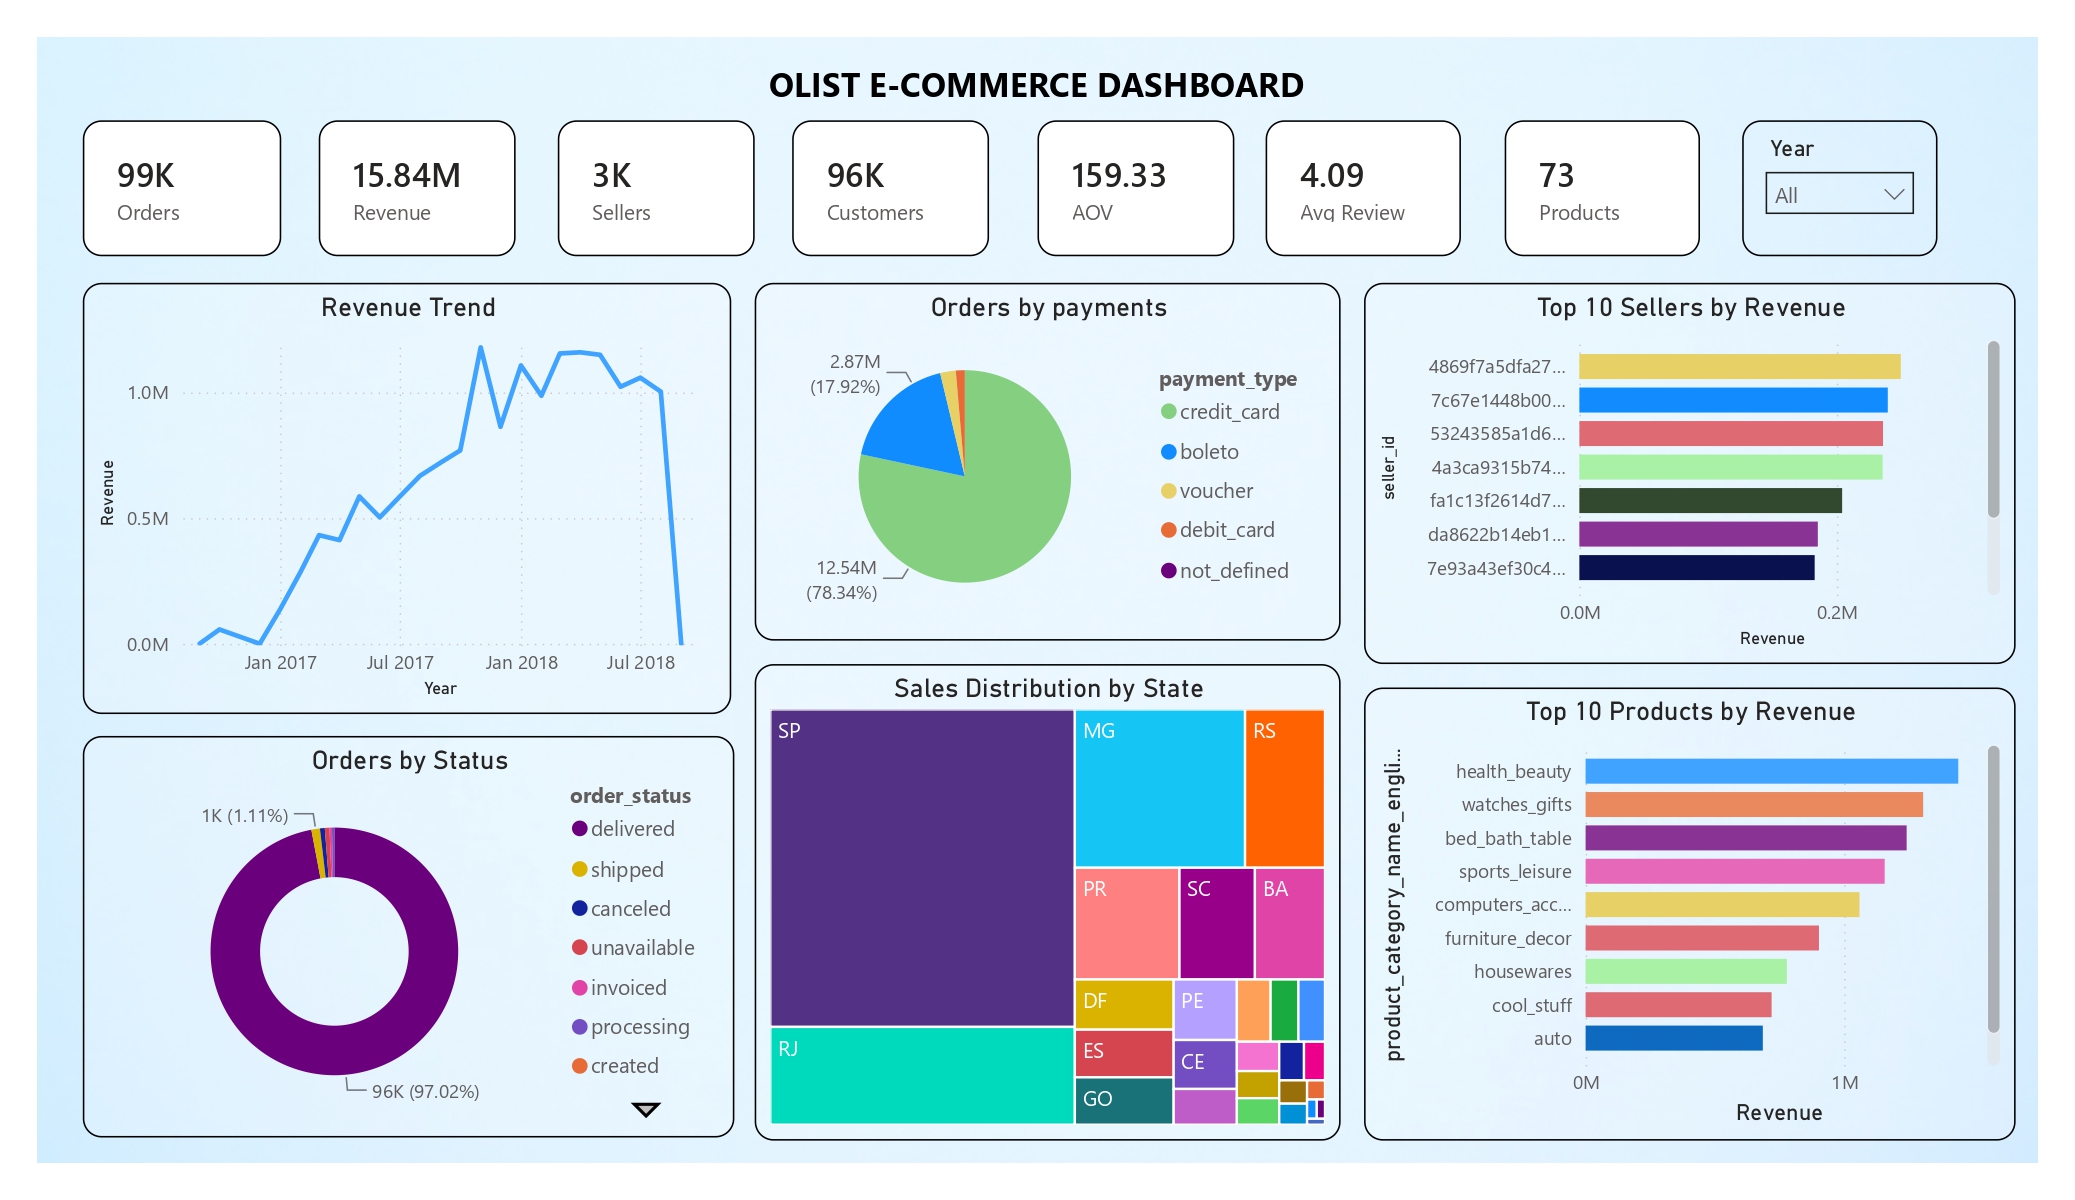
(The dashboard acts as an executive summary, while the highly granular analyses—such as average installments per product, specific freight anomalies, and granular volume queries—are explicitly detailed in the SQL Analysis section above).
Actionable Business Takeaways
- Capitalize on São Paulo (SP): With R$ 5.2M in revenue, 40k+ customers, and the fastest delivery times (8.7 days), SP is the undeniable core market. Marketing spend and seller acquisition should be heavily optimized here.
- Logistics in the North: States like Roraima (RR) and Amapá (AP) suffer from delivery times nearing 30 days. To improve market penetration in the North, localized distribution centers or specific carrier partnerships are necessary.
- Credit Card & Installment Dependency: With over 76k transactions via credit card and an average of 2.85 installments, Olist must continue to negotiate favorable merchant rates for credit installments. Products pushing 8-10 installments require higher margins to offset credit risk.
- Category Strategy vs Inventory: While "Bed, Bath & Table" has the highest number of products (3,029), "Health & Beauty" and "Watches & Gifts" drive higher total revenue. Identifying top-performing sellers in these high-revenue categories and offering them premium platform placement could further accelerate GMV.
Tools & Technologies
| Tool | Purpose |
|---|---|
| MySQL | Relational database for executing complex queries and aggregations |
| Python | Core language for database connectivity and data pipelining |
| Pandas | Fetching query results, dataframe manipulation, and data cleaning |
| Power BI | Interactive executive dashboard for visualizing core business KPIs |
| Jupyter Notebook | Interactive development environment for the full analysis pipeline |
Analysis conducted on a real-world e-commerce dataset containing 99k+ orders. All metrics reflect direct SQL queries executed on the raw database.